Having put an offer in to purchase The Outpost in 2019, Richard and I were in for a bit of a wait before we actually got here. Nevertheless, I immediately purchased a digital weather monitor from 1-day. It sat in our spare bedroom for a couple of months before everything went through and we finally took possession.
After picking up the keys the next day, installing it was my highest priority. It was raining, and quite a mission, but I got there in the end. It’s been faithfully recording rainfall, sunshine, wind, and temperature ever since. The data it has collected is endlessly fascinating to me.
I am a geography major, and I knew that the more data we had to read, the better we will be able to make decisions about the land. Our ‘data year’ rolls over in August, and we now have two year’s worth. So what does it say about the rain?
“It’s been a wet winter”
Two neighbours have remarked to me how wet this winter has been lately. And yes, if I didn’t have a couple dozen spreadsheets that said otherwise, I might think so too. Perhaps, when compared to a very dry winter, it is wet.
It feels like it’s been raining non-stop. Finding an opportunity to wash the sheets or mow the lawns is difficult. But actually, it’s drier than the year before.

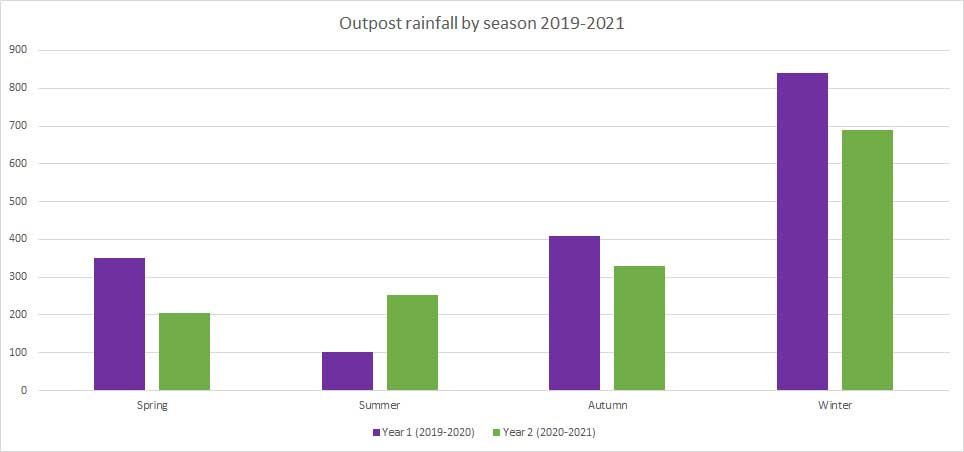
In year one, we had a wet spring, a dry summer, a wet autumn, and a wet winter.
In year two, we had a dry spring, a comparatively wet summer (though, as we will see soon, that is mostly one downpour in February), a drier autumn, and a much drier winter.
Feast or famine
When we get rain, we often get it all at once.

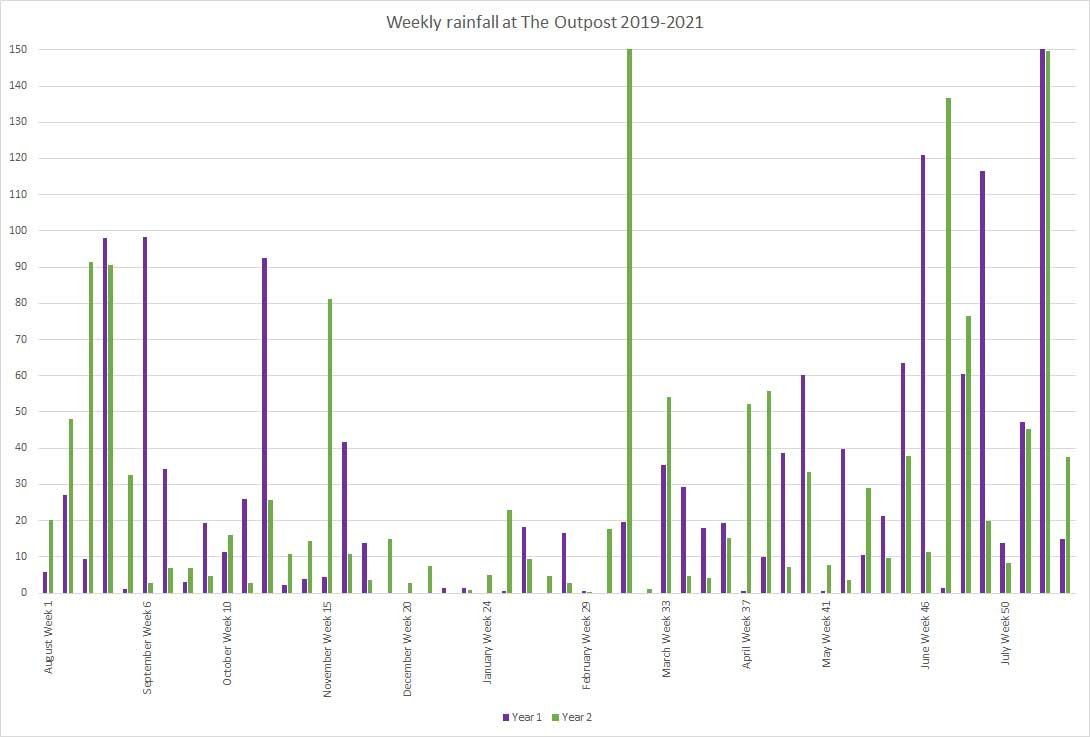
This is a weekly rainfall graph. Firstly, I draw your attention to the three spikes that go to the top of the chart. I’ve cut the axis off at 150mm to prevent the scale being warped by the outlying rainfall events. They were 254.7mm recorded in July 2020 (where the image at the top of the page comes from); 180mm recorded in February 2021; and 149.7mm in exactly the same week of July 2021.
There are three weeks where we received over 100mm, and another five weeks where we received over 90mm.
Of the 104 weeks shown here, 19 of them received over 50mm. That means of the 3192.8mm total rain we’ve received in the first two years, 1933.8mm – 60% of our total annual rainfall – arrived on those 19 (18%) weeks.
In summer, we’ve recorded 8 weeks with absolutely no rainfall at all over the two years. Additionally, there were 26 weeks where we recorded some rain, but less than 5mm. Over those 26 weeks, we recorded 66.3mm – just 2% of our total rainfall.
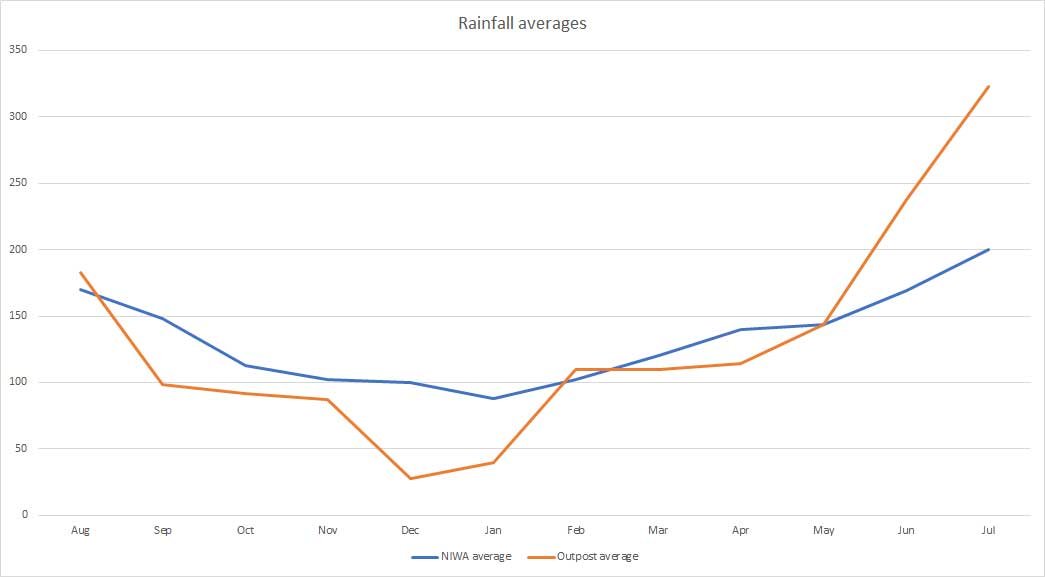
Our average of 1596.4mm a year (over two years) is 0.4mm more than what NIWA indicated the average here would be. It’s quite remarkable how close it is. Especially considering the distribution is — well — not.
Is it a pattern?
I’ve only got 2 full years of data, plus the local data I sourced from NIWA while researching the area. It’s way too early to say anything for certain. But so far, it does seem like there’s a pattern forming around our rainfall.

Wet winters, dry summers. It’s pretty simple. It may be that over a longer time period, our averages will look something more like NIWAs.
One thing Northland hasn’t seen in a few years is a tropical hurricane in summer, which would boost the rainfall number in January especially. And I haven’t experienced anything I’d call a ‘dry winter’ in Northland, and that’s probably a thing that appears over larger datasets.
But it’s also possible that without the historical dataset of the 20th and early 21st centuries, what we’re seeing is climate change.

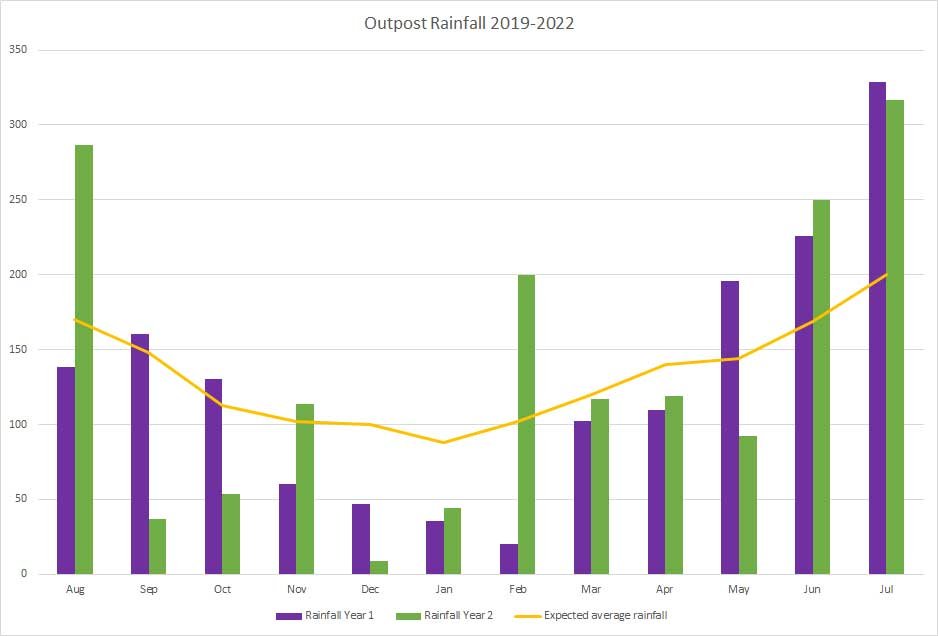
Two years is a terrible number of years to draw an average from, but here you have it (except for August, which is 3 years). There are some months that look very similar to NIWA’s averages (which are real averages, derived from way more data), so over time I think they’ll prove reasonably reliable.
It’s about the extremes
But there are a couple of very, very different months – December, January, June and July, to be exact. Those months have been way out of whack so far.
December and January are dry months. Last December we got 9mm of rain all month! NINE! That’s not even one measly centimeter of rain over 31 hot, blazing days.
On the opposite end of the scale, in June and July it can require a 4WD vehicle to get out our driveway. Temporal springs and streams pop up. Our rain-fed pool is deep enough to look appealing for a swim. We had 250mm of rain in the space of one week. 25cm. In one week. Get out a ruler and think about that for a second.
The way I read it, the extremes are getting more extreme. Another way to say it is that the climate might be changing.
It’s early days. I plan to collect a lot more data yet, and with more information, any patterns will solidify or dissolve. Stay tuned to see how it turns out, I guess.


Hi Kat and Richard, Is that pond in the photo in your property?
What way do you save water to feed your gardens? I’m running five 1000L water tanks of my roof and this keeps the garden off town supply most of the year round. Thanks for your news letter.
Stay safe.
Hi Rob, we’re planning to build a rain collection structure specifically for the garden. Now we’ve finished the top row of beds, we should be able to get on with it soon. I’m sure it’ll get a blog or two dedicated to it. However, to-date, the garden has been supported by rainfall and watering cans – which means it suffers a lot!
The ‘pond’ in the photo is an ephemeral pond – it only appears when it rains heavily (such as the ~250mm we had in the week it was taken). We have maybe half a dozen of these, plus a rain-fed pond in the bush block. Again, there’s plans to dam off some of these ponds and create more water-holding capacity, but we need to get a digger in to really get started on that. 🙂