
For the second month in a row - and the third time in the past 12 months - we've recorded an entire month's worth of rain in a single 24 hour period.
It's caused even more havoc locally than it did last month. The local Facebook page has been full of news and photos. The BP closed for the day, school busses didn't run. We went for a 'tiki tour' early yesterday and saw cars that didn't make it through the flood waters pushed to the roadside - hoods full of debris - waiting for their owners to collect them now the flood has subsided.
I never thought I'd live in Kaeo. When we were looking for a place to live, we came up with a system of "would prefer" / "would consider" / "won't consider". Low-lying flood-prone areas subject to ocean level rise were very firmly on the "won't consider" list. For the most part, we didn't even look at those listings after they were located on a topo map.
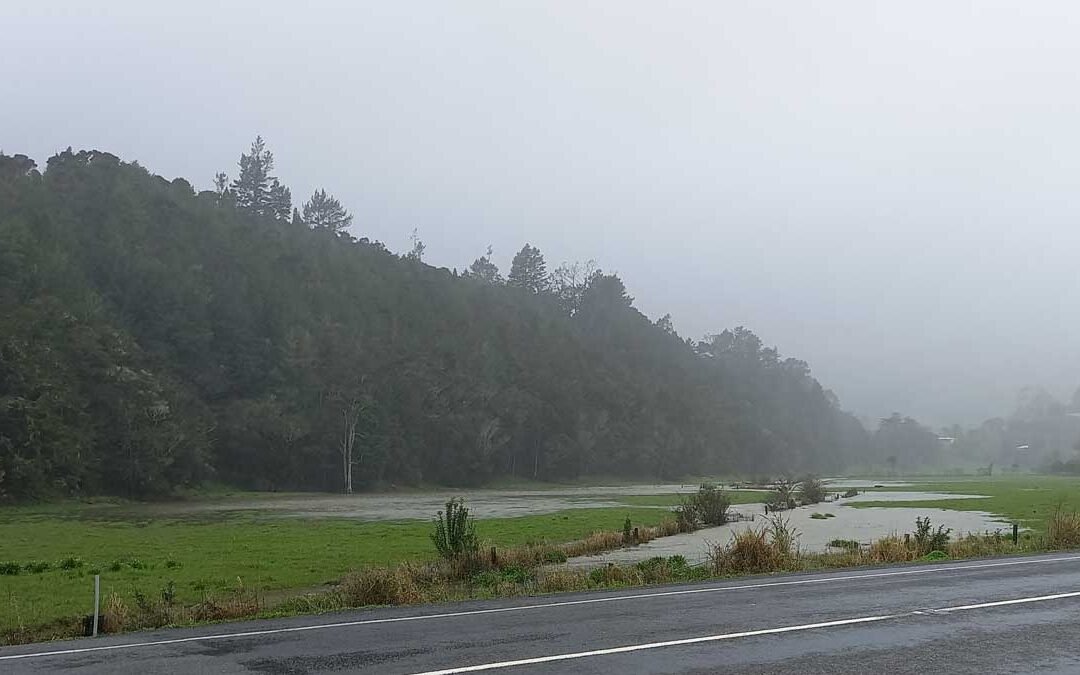
So initially I thought Kaeo was not even worth considering (which was a shame, because I've always liked it, along with many other low-lying and seaside towns). Kaeo village has flooded for longer than it has existed. The image at the top of this page was taken 2 days after the major rainfall and is just over the road from the Four Square and 'Farm and Fuel'. It doesn't normally look like a lake... unless we've had a big rain, of course.
But then we found this property - 80m above sea level and in the hills to the south of any expected flooding issues. The sea would have to rise 50m to touch us, and even then it just tickles the outer corners.
So when it floods, we're quite safe. But we do experience the rain that comes with living in a flood zone.
Expected averages
The day we took possession of this property, I installed a weather monitor. Then I put together a spreadsheet based on NIWA's averages (PDF) and started measuring how much rain falls. This month, we entered our fourth year of monitoring.
For the first two years, the distribution was off, but overall we received an average amount of rain. A little less the first year, and a little more the second. But it averaged out almost exactly.

But we've just concluded 12 very wet months. We ended up with a surplus of almost 900mm. Our rain levels this year have been comparable to the West Coast.
And honestly, that scares me a little. Because somewhere along the way, it's very likely that those 900mm are going to average out.
Some colourful graphs
This week has been wet. I've been confined to our cabin, and I've spent some time playing with spreadsheets and numbers.


Year four begins
Those graphs don't really explain what happened this week because they end in July, so let's just compare the four Augusts we have experienced to date.
")
One of the weirdest things about this graph is three out of four years, we've had a decent dump of rain around August 15 and 16. I'd like to extrapolate from that to say we should have some dry weeks ahead... but that's not what the rain radar says.
There's no rhyme or reason to when the rain will fall. We can't use this data to say August 15 will most likely be a very wet day. It's also an interesting human habit I've witnessed in farmers to think 'well last year was wet so this year will be dry'. It doesn't actually work like that either.

But in our time here I've learned winter in the Far North is less of a cold season, and more of a very wet season. We've been consulting with engineers lately about building a house and one thing I was surprised to learn is that we are expected to get drier over time. So to be honest, these dumps of rain leave me pretty worried about the droughts that will inevitably even out the average eventually.
But for now we have soils primed for planting. Whenever the rain stops falling, I'd like to get out and do that!

READ NEXT
Rainfall
Another post analysing our rainfall data.

READ NEXT
An ode to rain
Rain after drought is just lovely.
Related content: climate change · data · drought · Far North · flooding · graphs · house build · infrastructure · Kaeo · NIWA · Northland · property · rain · rainfall · resilience · The Outpost · weather · weather monitor
Stay in touch?
The Kat's Garden newsletter gives readers an extra peek behind the scenes. It's the best way to know when new posts go live, and what's happened since.
If you like what you've seen, join us and see what we learn next.

Hi. What weather monitor do you have? We have bought a section and are building a house in rural north west auckland and I’d love to put a weather monitor in but am struggling with choosing one as there’s too many options.
No brand – a cheap and cheerful from 1-day.co.nz (by cheap I think I mean about $300). If I were looking for another one today, I’d want one with a wall display and WIFI connectivity (which we have now). We have to remember to swap the batteries and clean off the cobwebs once a year, but otherwise it’s been mostly-reliable for 3 years now. I don’t know that the extra spend on a particular brand would give us a much better result. It has held up remarkably well.